
Responsive Hexagonal Grids
How the (q, r) coordinate system and linear transformations are used to place tiles, roads, and settlements on a responsive SVG Catan board.
This blog post belongs to a three-part series: Responsive and Resilient Catan Board
- Responsive Hexagonal GridsNow Reading
- Deriving Display State
- Resilient Road Placement
The Catan board you see above is rendered as a single SVG. Each item on the board is just a child element within this SVG. Whenever game state changes (e.g., a road is placed), the SVG must be updated with new or modified child elements.
We will cover how the Settlers React demo converts a given game state into SVGs like the one above. Once the coordinates are computed, the browser handles the responsive sizing of the SVG for us.
Our Rendering Strategy
A standard Catan board is a hexagonal grid of tiles with various items placed on it:
- Chits (the numbers at the center of tiles)
- Settlements
- Roads
- Ports
Everything in the SVG is represented using Cartesian coordinates and a bounding box defined by the minimum and maximum x and y values. We need to find the (x, y) position of each tile or item and then use primitive SVG elements like polygon to draw shapes.
In general, SVGs require you to deal with calculating coordinates just once. Browsers then work their magic and properly scale the SVG anywhere it is used. This is the key benefit of drawing the board with SVGs.
If you can find the center (x, y) coordinate of each hexagon, all other items can be drawn relative to these centers. Our approach to rendering the board is:
- Choose how many hexagons we need, how large they will be, and if there will be gaps between them.
- Label these hexagons according to the hex coordinate system (
(q, r)).- The hex coordinate system is covered in the section below.
- Translate each hex coordinate to its Cartesian coordinate (
(x, y)). - Use geometry (in the Cartesian coordinate system) to calculate vertices, edges, and positions of other items.
- Build primitive elements like
polygonbased on the calculated coordinates. - Find the minimum and maximum coordinates of all elements, then set the bounding box values.
We will see that the hex coordinate system makes finding the center (x, y) coordinate of each tile easy.
The (q, r) Hex Coordinate System
There are many good references on hex grids online. I will only cover the main idea here. The reference grid below shows a coordinate system designed for working with hex grids.
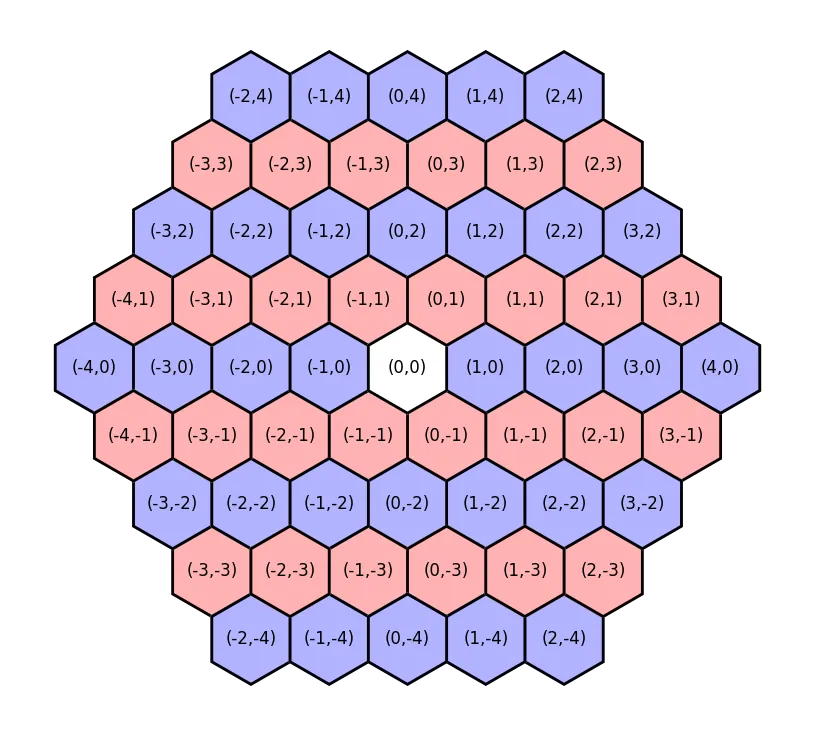
Credit to Milo Trujillo for this graphic of the hexagonal grid system.
Each tile gets a (q, r) tuple, where q is the column coordinate and r is the row coordinate. A quirk of this system is that two tiles with the same q value do not sit in the same vertical column. In other words, both the q and r values are needed to determine the x position of a grid element.
We use this coordinate system because it’s well-studied and there is a simple linear transformation from it to Cartesian coordinates. Since the Catan board never changes shape, we could instead derive the center (x, y) coordinates of the 19 tiles once by hand with basic geometry and trigonometry. The hex system earns its keep when the board is variable, spacing between tiles changes, or you need to reference tiles relative to each other. A full implementation of Catan would almost certainly want these benefits.
Converting Hex Coordinates to Cartesian
The final position of every SVG element is derived from (q, r) grid coordinates. SVG elements have to be defined in terms of traditional (x, y) coordinates, so we need to translate between the two systems.
We can find the Cartesian center of a hex tile with a simple linear transformation. Given a (q, r) pair, we compute a corresponding (x, y) pair. The matrix values are well-established and can be derived with geometry. HEX_SIZE is the distance from the hexagon’s center to its vertices in pixels.
Note that the matrix reflects our earlier observation that
xdepends on bothqandr.
For (q=2, r=2) and HEX_SIZE = 40, we get the following coordinate:
Using Geometry to Draw Items
Once we have the center of a tile, we can find its six vertices using trigonometry. Each vertex sits on a circle of radius HEX_SIZE around the center coordinate and is rotated 60 degrees from the previous one.
The gridDataBuilder.ts code below computes the six vertices based on the provided center coordinate. All points are Cartesian coordinates.
// get the 6 vertices of a hex centered at point p
function hexVertices(p: Point): Point[] {
  const vertices = [];
  for (let i = 0; i < 6; i++) {
    const angle = (60 * i - 30) * (Math.PI / 180); // convert to radians
    const x = p.x + HEX_SIZE * Math.cos(angle);
    const y = p.y + HEX_SIZE * Math.sin(angle);
    vertices.push({ x, y });
  }
  return vertices;
}
We then pass these vertices to a polygon element (a Tile React component).
import { BoardColor } from '../../types/enum/BoardColor'
import type { Point } from '../../types/board-internal/Point'

interface TileProps {
  idExternal: string
  vertices: Point[]
  color: BoardColor
  onClick: (id: string) => void
}

export function Tile({ idExternal, vertices, color, onClick }: TileProps) {
  const points = vertices.map((v) => `${v.x},${v.y}`).join(' ')

  return (
    <polygon
      points={points}
      fill={color}
      stroke={BoardColor.BLACK}
      strokeWidth="1"
      style={{ cursor: 'pointer' }}
      onClick={() => onClick(idExternal)}
    />
  )
}
If you’re curious, you can inspect the raw SVG elements that the app generates. Note that the center (x, y) coordinates of the hexagons are never mentioned, since each hexagon is a polygon element. polygon elements are entirely defined by their vertices, not centers.
We have similar code for chits, settlements, roads, and ports. Ports are particularly geometry-heavy because they are trapezoids at somewhat irregular angles.
SVG Elements as Native DOM Nodes
As mentioned earlier, SVG elements (and their children) are native DOM nodes. They have all the same features as common HTML elements like <div> or <button>.
- Queryable via
getElementById()andquerySelector. - Interactivity via
onClickandonMouseEnter. - Styling via CSS selectors like
:hoverand:focus. - Dynamic creation and deletion via
document.createElementandelement.remove().
The interactive road placement covered later in this series takes full advantage of these features.